Positive Reply Rate vs Reply Rate: 432 Cold Email Replies, 56 Positive, and What Separated Them (2026)
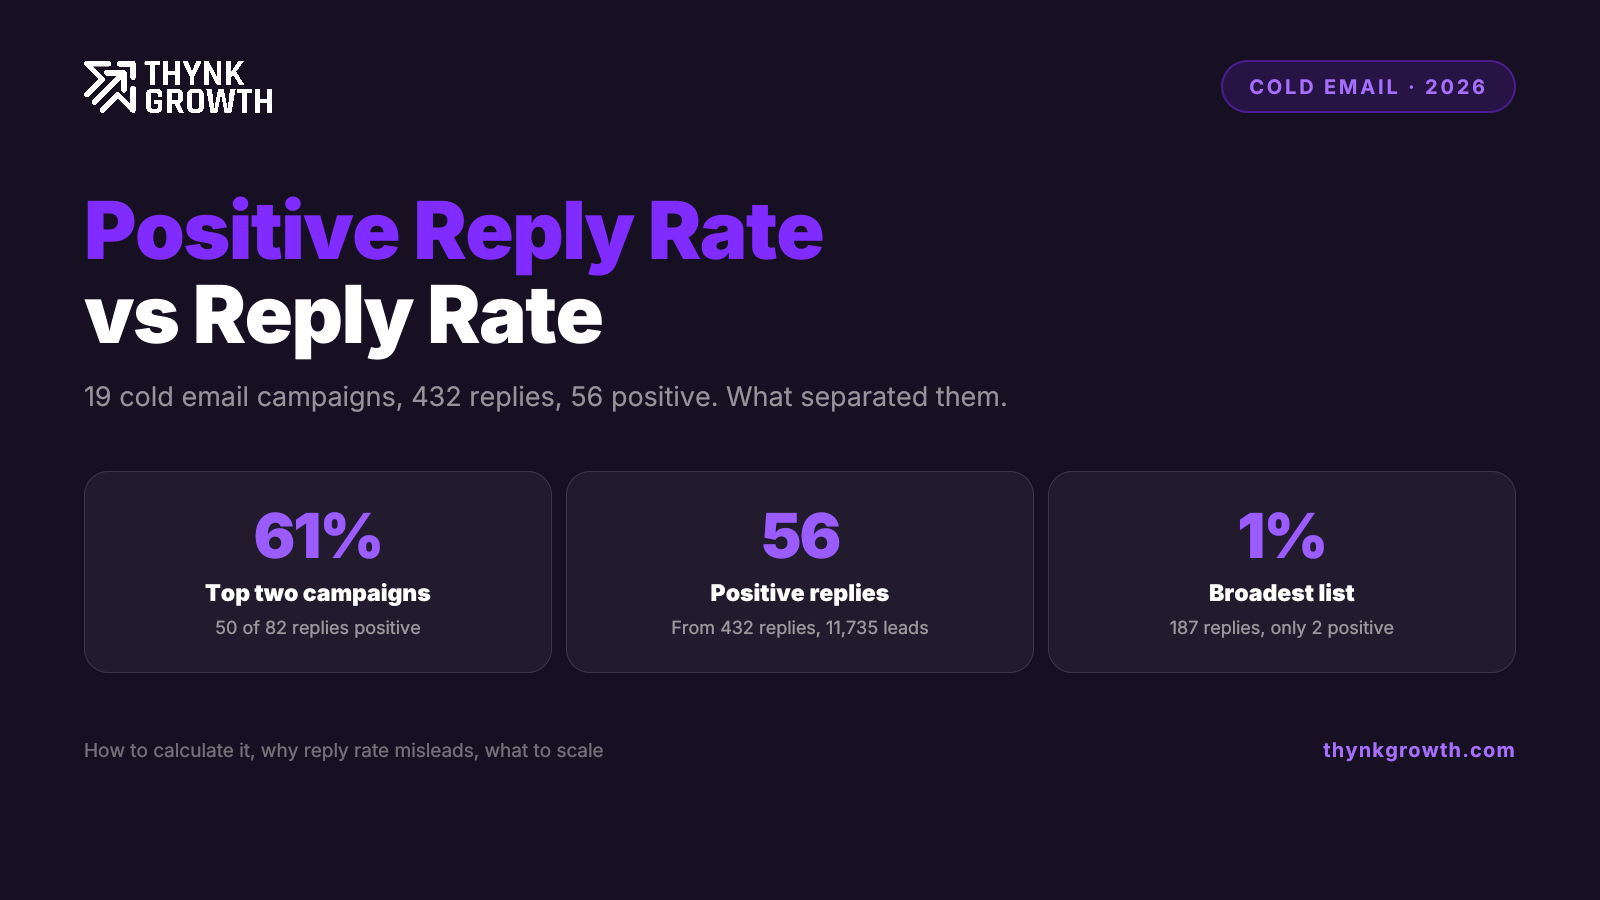
TL;DR: From April to June 2026, a B2B marketing agency ran 19 cold email campaigns. They reached 11,735 leads with 32,484 emails and got 432 replies, a 3.68% reply rate per lead. 56 of those replies were positive, a 13% positive reply rate overall. The average hides the real finding: the agency's two best campaigns turned 57% and 63% of their replies positive and produced 50 of the 56 positive replies, while its broadest list got 187 replies and only 2 positive ones. For context, a Sales.co analysis of over 2 million cold emails found only 14.1% of replies were positive. Reply rate tells you where the noise is. Positive reply rate tells you where the buyers are.
I run ThynkGrowth, a signal-led outbound agency based in Bangalore, India. Before ThynkGrowth I built the outbound engine behind a $6.12M quarterly pipeline for a 70-person BDR team at an enterprise SaaS company. Everything below comes from a B2B marketing agency's Smartlead account: every campaign that ran in the quarter, full results, replies tagged in Smartlead, nothing left out.
What is a positive reply rate?
A positive reply is a reply where the lead shows real interest: they ask for details, ask for pricing, or agree to a call. Out-of-office messages, "not interested" and unsubscribe requests do not count.
There are two ways to express it, and you should track both:
- Share of replies: positive replies divided by total replies. This tells you whether your targeting and message attract the right people.
- Share of leads contacted: positive replies divided by leads contacted. This tells you how many interested conversations a list of a given size will produce.
The agency's SaaS campaign shows the difference. It reached 2,256 leads and got 54 replies, 34 of them positive. That is a 63% positive reply rate by share of replies, and 1.51% by share of leads contacted. Both are true. Always say which one you mean.
Cold email results: 19 campaigns, April to June 2026
| Metric | April to June 2026 |
|---|---|
| Campaigns | 19 |
| Leads contacted | 11,735 |
| Emails sent | 32,484 |
| Replies | 432 |
| Reply rate | 3.68% of leads contacted (1.33% per email) |
| Positive replies | 56 |
| Positive reply rate | 13% of replies (0.48% of leads contacted) |
Source: Smartlead, full results for every campaign that ran in the quarter, with replies tagged in Smartlead.
What is a good positive reply rate in 2026?
The most useful benchmark comes from a large dataset rather than a rule of thumb. According to Apollo's 2026 summary of Sales.co research, which analysed over 2 million cold emails, the average reply rate was 2.09% and only 14.1% of those replies were genuinely positive, roughly 0.64% of everyone emailed.
| Positive reply rate (of replies) | Positive replies (of leads contacted) | |
|---|---|---|
| Industry average (Sales.co, 2M+ emails) | 14.1% | about 0.64% |
| This agency, all 19 campaigns | 13% | 0.48% |
| This agency, top two campaigns | 61% | 1.13% |
Across the whole account, the agency sat close to the industry average. Its two best campaigns ran at more than four times the average share of positive replies, and nearly double the average per lead. Published benchmarks vary widely, partly because some divide by replies, some by emails and some by leads, so always check the denominator.
The campaigns that drove the positive replies
| Campaign | Leads | Replies | Positive | Positive reply rate (of replies) | Of leads contacted |
|---|---|---|---|---|---|
| SaaS companies | 2,256 | 54 | 34 | 63% | 1.51% |
| Marketing companies | 2,153 | 28 | 16 | 57% | 0.74% |
| Top two combined | 4,409 | 82 | 50 | 61% | 1.13% |
| Broad marketing list | 3,333 | 187 | 2 | 1% | 0.06% |
The top two campaigns produced 50 of the quarter's 56 positive replies. Both had modest reply rates, 0.85% and 0.45% per email, the kind of numbers that would get a campaign paused if you only watched replies.
The broad marketing list was the opposite. It had the most replies in the account, 187, and only 2 were positive. Most of its replies were tagged neutral in Smartlead, the bucket where out-of-office messages and auto-replies land.
Why doesn't a high reply rate mean more positive replies?
Reply rate counts every response, including automated ones. A large, well-delivered list will post a strong reply rate from out-of-office messages alone, without a single buyer in it. A tight segment replies less often, but the people who reply are mostly the ones who want to talk.
That is the case for making positive reply rate your primary metric:
- Reply rate measures attention, including automated attention. Out-of-office replies count as replies in every sending tool.
- Positive reply rate measures demand. It is the closest leading indicator you have to meetings.
- The account average hides the winners. A 13% overall rate sat on top of two campaigns above 55%.
If this agency had scaled by reply rate, it would have doubled down on the 187-reply list. Scaling by positive reply rate points to the two segments that produced 89% of the interested conversations.
Per email or per lead: which denominator?
Smartlead divides replies by emails sent, while most published benchmarks divide by people contacted. With a three-step sequence, each lead gets up to three emails, so the per-lead reply rate runs roughly two to three times the per-email rate. Here, that is 3.68% per lead against 1.33% per email. Check the denominator before you compare your dashboard with any benchmark.
How do you calculate and track positive reply rate?
- Tag replies daily as positive, negative, neutral or out-of-office.
- Report both versions: share of replies and share of leads contacted.
- Rank by positives, not replies. Sort campaigns by positive replies before deciding what to scale.
- Break it down by segment. An account average of 13% hid two campaigns above 55%.
- Compare against a benchmark with the same denominator. Published benchmarks mix share of replies, share of emails and share of leads, so check which one a number uses before you compare.
Methodology
- Source: the agency's Smartlead account, full results for every campaign that ran between April and June 2026.
- Leads contacted: unique people who received at least one email. Each sequence had up to three emails.
- Replies: every reply Smartlead recorded, including out-of-office messages.
- Positive replies: replies tagged as interested in Smartlead, such as a request for details, pricing or a call.
- Nothing excluded: all 19 campaigns are counted, including the ones with no positive replies.
Who ran these campaigns
ThynkGrowth is a signal-led outbound GTM agency based in Bangalore, India, and a Clay Solutions Partner. Our GTM engineers build outbound engines inside our clients' own accounts for B2B companies: infrastructure, signal-based lists, messaging and the reply tagging behind numbers like these. If you are comparing partners, what a cold email agency does and how to choose one is a fair place to start.
What is a good positive reply rate for cold email?
A Sales.co analysis of over 2 million cold emails found that 14.1% of replies are positive on average, about 0.64% of everyone emailed. In this post, the agency's overall rate was 13% of replies, and its two best campaigns reached 57% and 63%.
What is the difference between reply rate and positive reply rate?
Reply rate counts every reply, including out-of-office and refusals. Positive reply rate counts only replies showing interest. In this data, a broad list got 187 replies but only 2 positive, while a focused SaaS campaign got 54 replies and 34 positive.
How do you calculate positive reply rate?
Divide positive replies by total replies for the share of replies, or by leads contacted for the share of leads contacted. Across 19 campaigns here, 56 positive replies from 432 replies and 11,735 leads gives 13% of replies and 0.48% of leads contacted.
Why can a high reply count produce few positive replies?
Out-of-office messages and auto-replies count as replies in sending tools. In this data, the campaign with the most replies, 187, had only 2 positive ones, because most of its replies were neutral.
Related reading
Want more replies that turn into conversations?
We build signal-led outbound inside your own accounts: infrastructure, signals, lists, copy and the rep workflow. Book a free strategy call and we will map your plan.
Book a free strategy call